Better Server Monitoring with CoreControl
I have been on a quest for some time now to find simple server monitoring. I feel like this has been a sore spot for the homelab community for awhile because to go-to is the Grafana/Prometheus stack, which I think is so over-complicated and not user friendly at all. However, since so many people swear by that, very few people try to build something better.
I know exactly what I want. I want a pretty dashboard which shows me what my CPU load is, how much memory is being used, how much hard drive space I have left, and how long my server has been on. Bonus points if I can see things like IP address, running services, docker containers, hardware configuration, etc.
Sounds simple, but you would be hard pressed to find something that does that but also works with Windows. I feel like that has been the Achilles heel of so many platforms out there. There are actually many which can do the above list, but I have Windows endpoints and I need everything in one dashboard.
Two other solutions pop up frequently: Checkmk and Zabbix. I feel like they are falling into the same trap of over-complexity. Also when I tried them they are just ugly. If I am using something for the dashboard, forgive me, but that should be nice to look at.
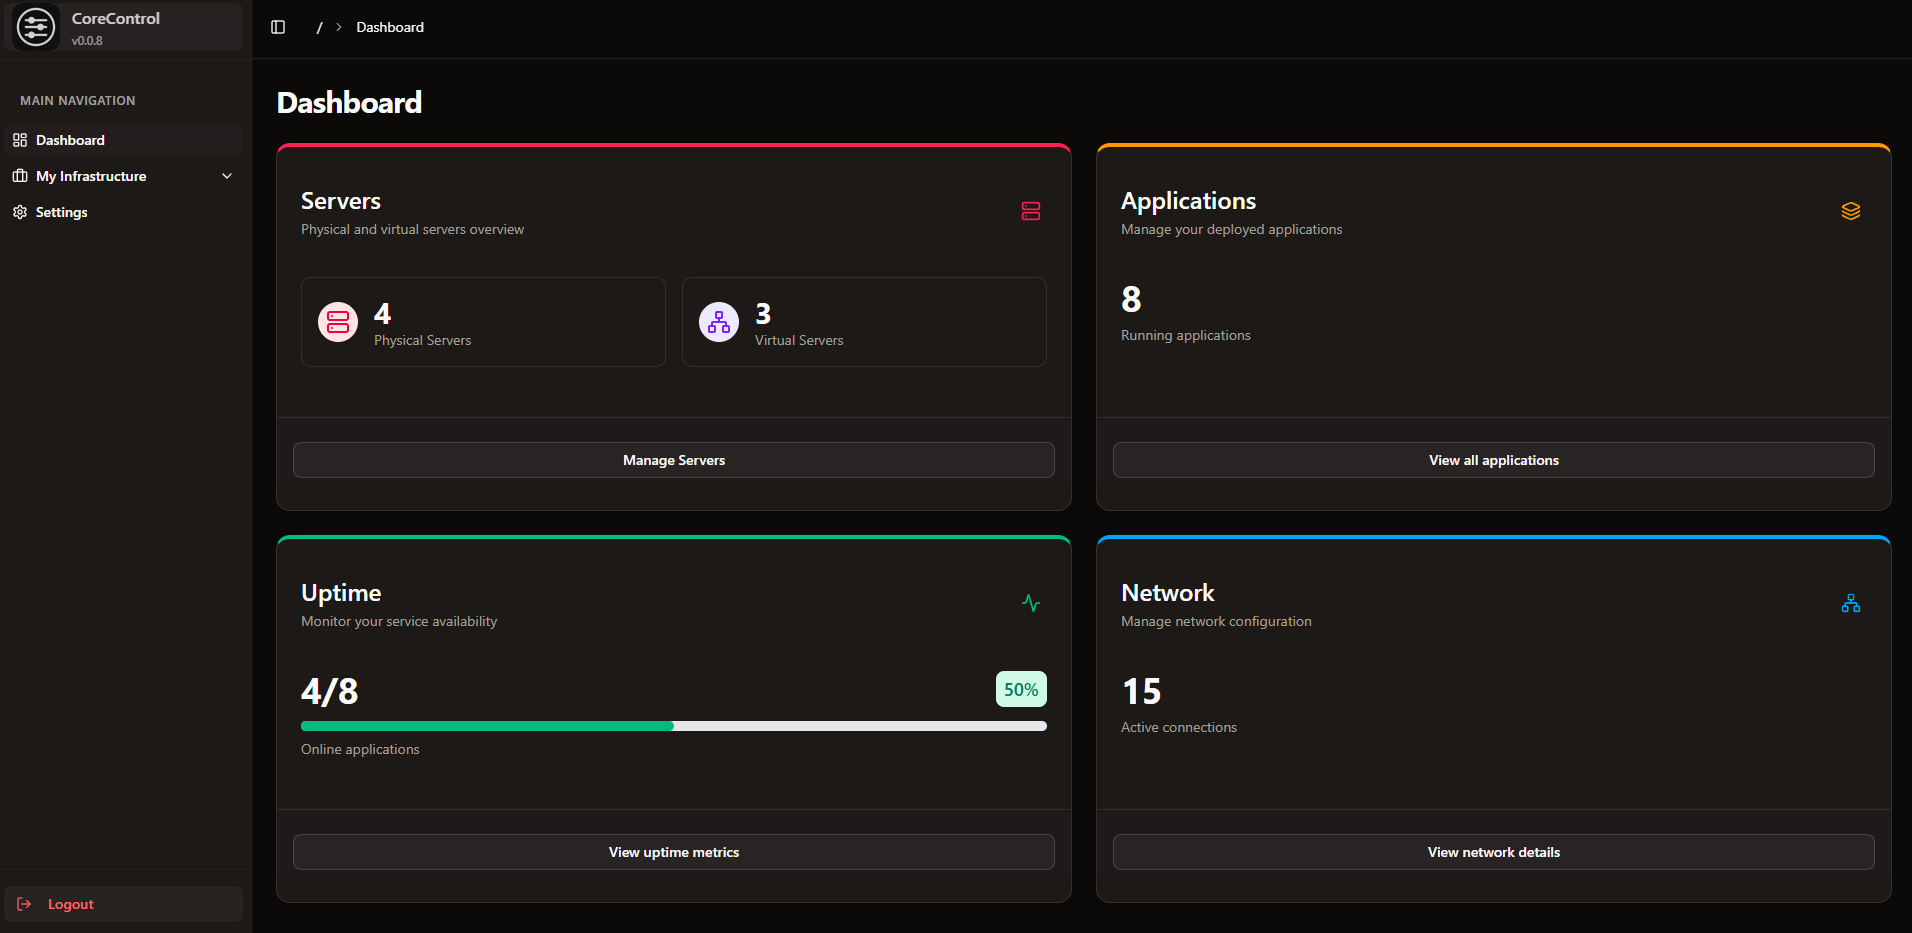
A new project has sprung up which checks a lot of my boxes: CoreControl. CoreControl is pretty basic and still under development, but so far I love it. Look at the server dashboard:
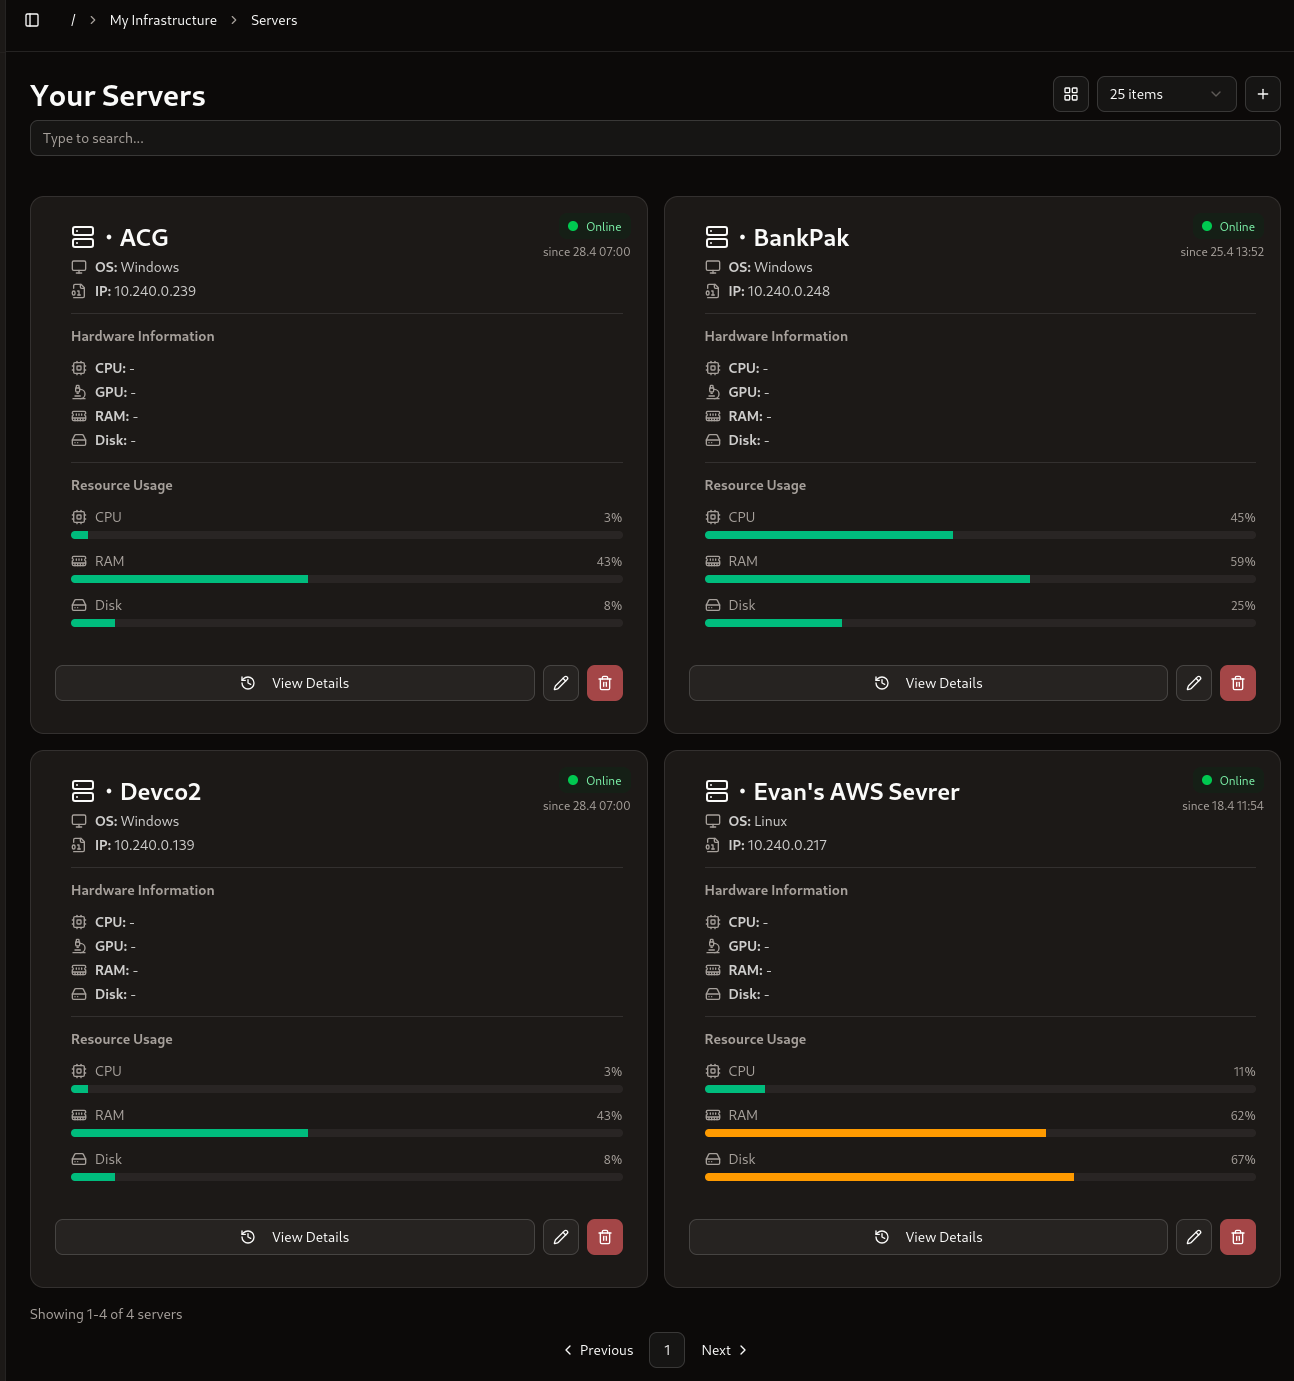
This is simple, straightforward, and only getting better. Some of my previous nice-to-haves are lacking in this image and that doesn't worry me one bit since the developer is on top of his game when it comes to pushing updates and incorporating new features. Two of my requests have already been merged.
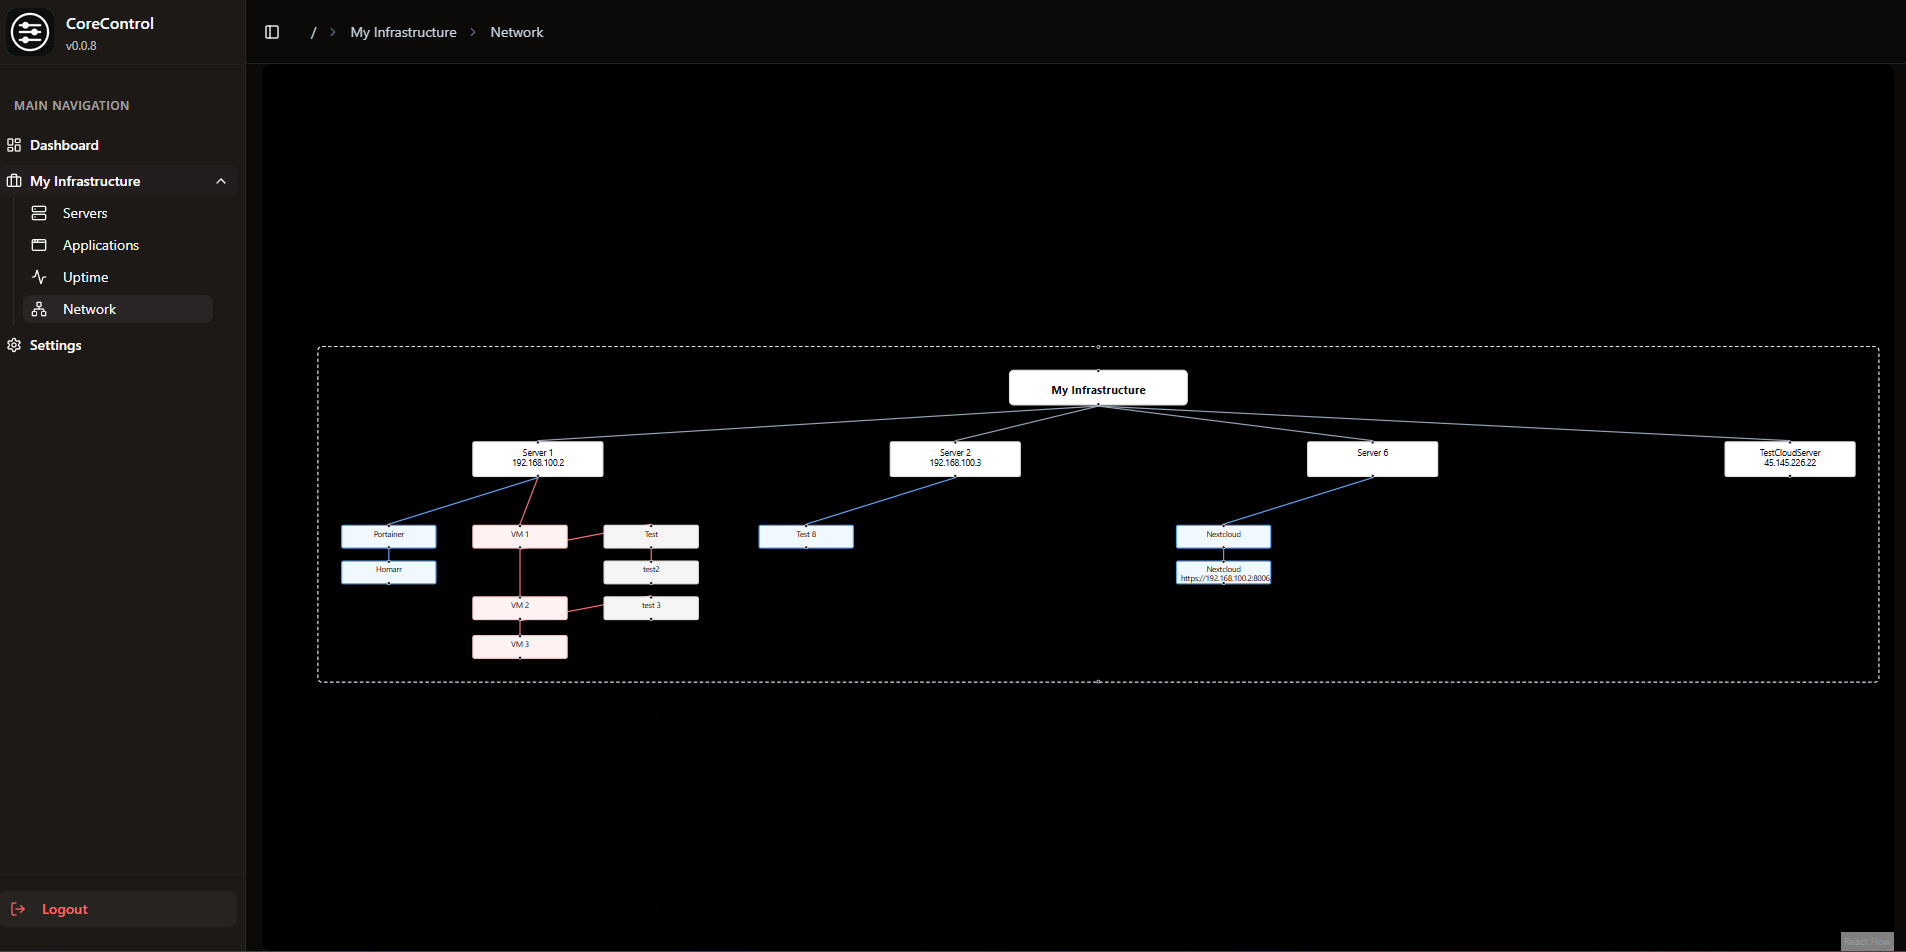
Server monitoring is not all that is to be found here. There is also an auto-generated network map (super cool),
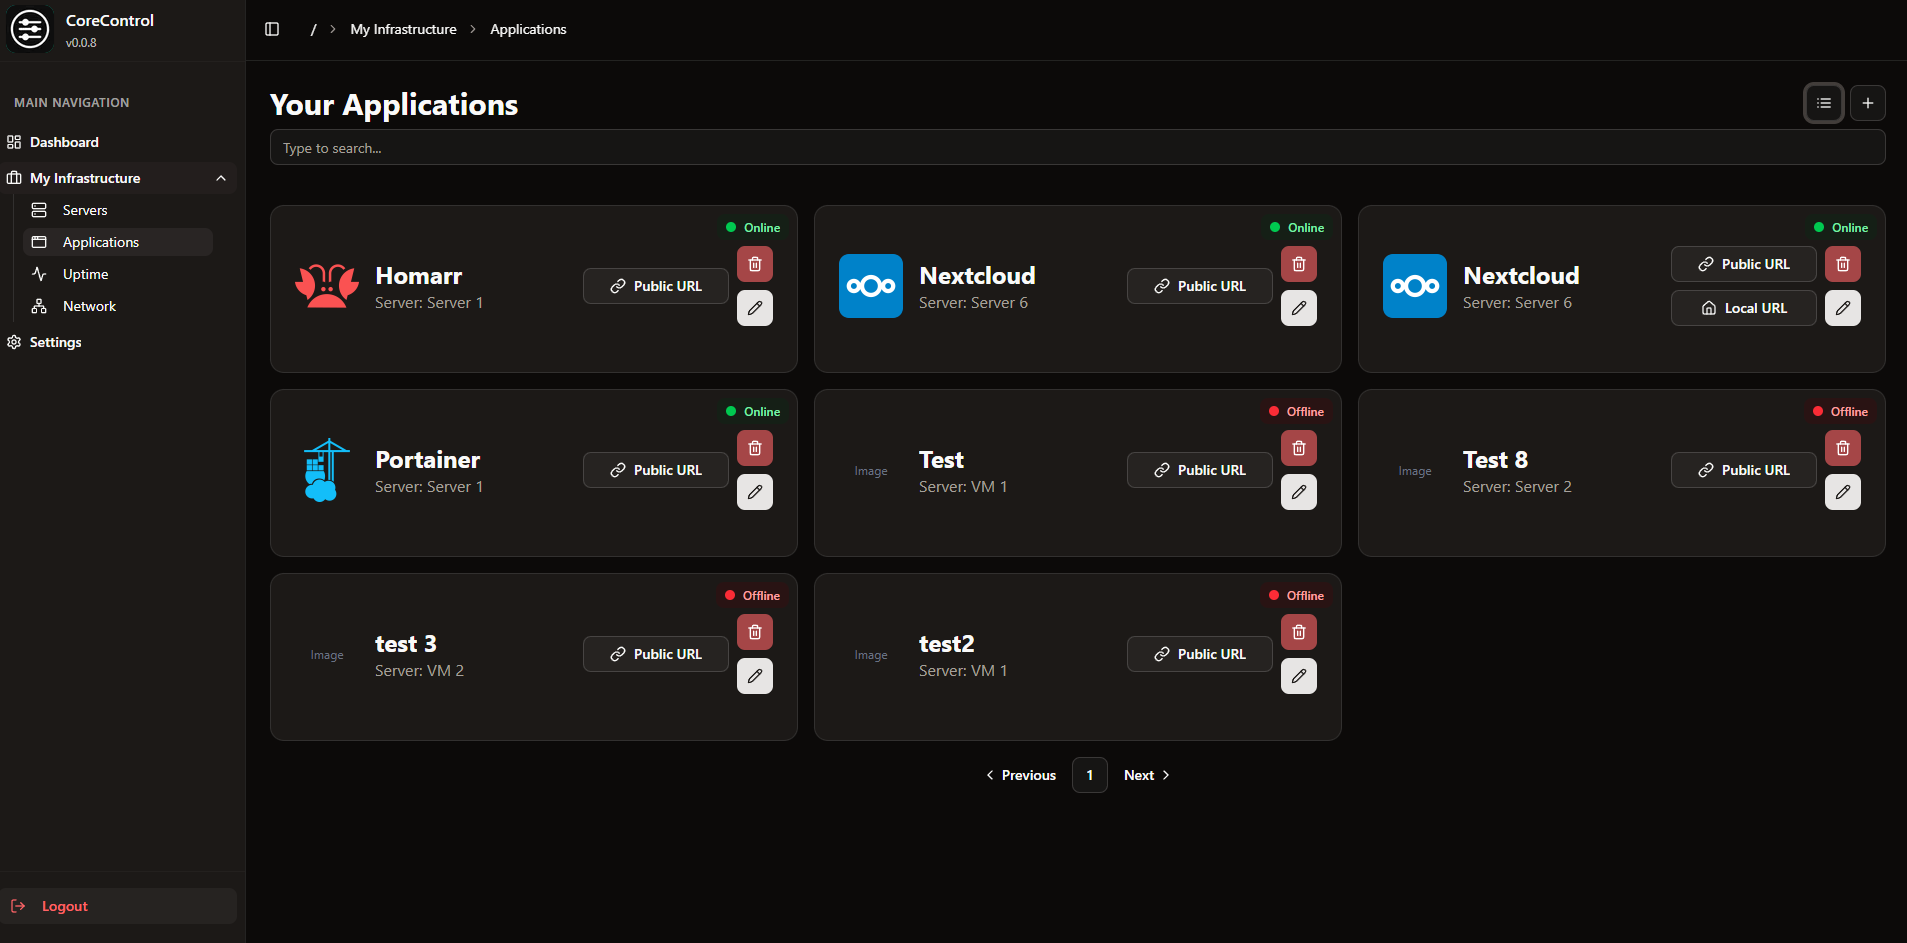
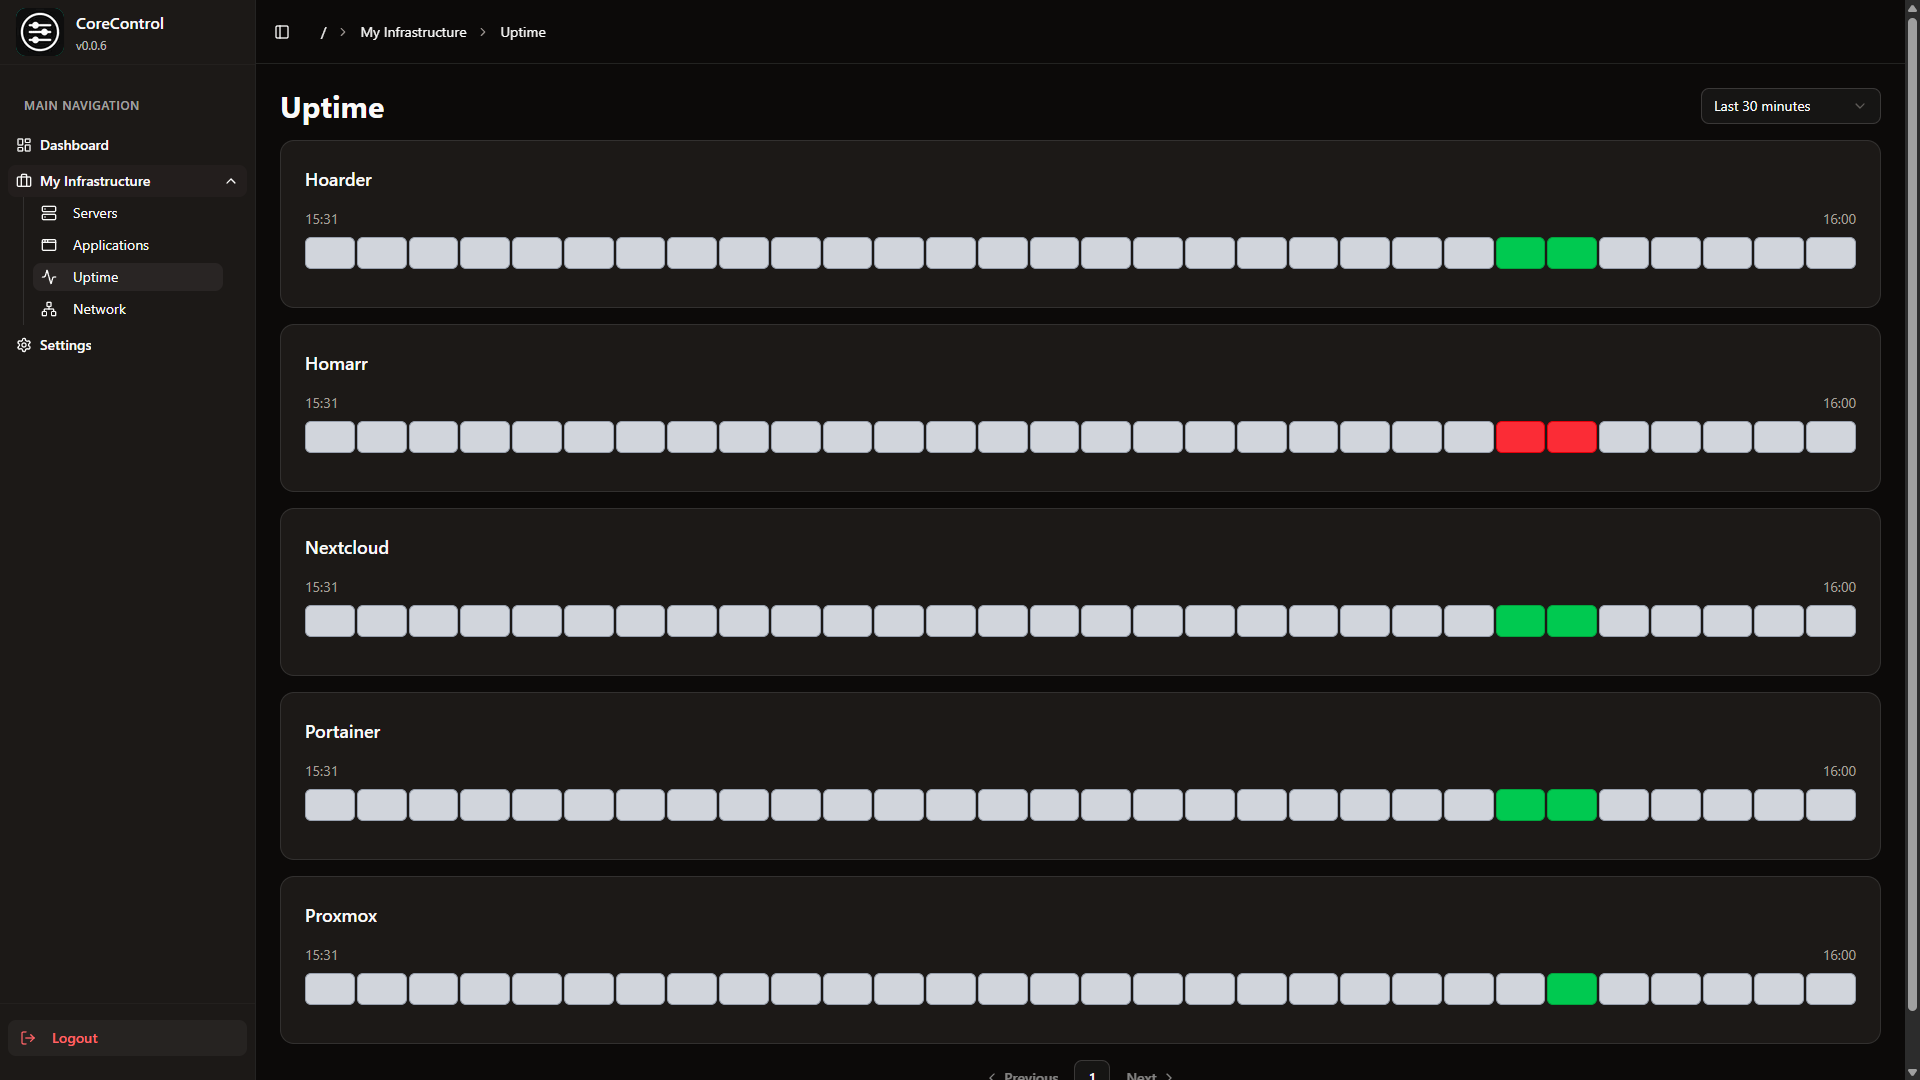
and an Applications page coupled with an Uptime page which is reminiscent of Uptime Kuma but not as feature rich (yet):
What makes me excited about this is it easy deployment to servers via docker compose or a custom powershell script I wrote for Windows. I had a fairly complex monitoring setup working in less than 5 minutes. The speed of development is also staggering. I am watching commits get made everyday with useful features that I plan on implementing in my deployment.
If you are looking for better server monitoring which is simple yet beautiful this is my #1 choice at the moment. Check it out on GitHub and give it a star.